#get list of filtered rows
dataTable = Document.ActiveDataTableReference
rows = Document.ActiveFilteringSelectionReference.GetSelection(dataTable).AsIndexSet()
#Script configuration
delim = ","
rowDelim = "\n"
docProperty = "myDocProperty"
#generate CSV
csv = ""
for column in dataTable.Columns:
csv += column.Name + delim
csv += rowDelim
for r in rows:
for column in dataTable.Columns:
csv += column.RowValues.GetFormattedValue(r) + delim
csv+=rowDelim
#show results
print csv

Unofficial Spotfire Collection of Script Snippets
Customer Banners (Ads) - SpiceUp. AX and SpotfireX Disclaimer
.gif)
Get visible rows from active visualization
myTable = Document.ActiveDataTableReference
for row in Document.ActiveFilteringSelectionReference.GetSelection(myTable).AsIndexSet():
print row
for row in Document.ActiveFilteringSelectionReference.GetSelection(myTable).AsIndexSet():
print row
Popup Calendar (WebPlayer compatible)
Update!
It is now easier and almost out of the box to use different date picker for date, time or even date-time by using the power of HTML5. No jquery or other libraries needed

html
date:<span class="date">
<SpotfireControl id="Spotfire Date Input Property Control" />
</span> (use M/d/yyyy formatting to have it work properly)
Time: <span class="time">
<SpotfireControl id="Spotfire Time Input Property Control" />
</span> (use this formatting: hh:mm:ss)
Datetime:<span class="datetime">
<SpotfireControl id="Spotfire DateTime Input Property Control" />
</span> (use this formatting: yyyy-MM-ddThh:mm
js
[...document.querySelectorAll(".date input")].map(x => x.type="date");
[...document.querySelectorAll(".time input")].map(x => x.type="time");
[...document.querySelectorAll(".datetime input")].map(x => x.type="datetime-local");
The above script will apply the proper type attribute value to each html5 input.
For the date pickers to hold the selected value, the Property Controls must be formatted accordingly.
| DataType | Format | |
|---|---|---|
| Date | yyyy-MM-dd | |
| Time | HH:mm | |
| DateTime | yyyy-MM-ddTHH:mm |
Old-way
Ingredients
- Spotfire 6.0 to Spotfire 11.4
- TextArea
- Input Field Property Control
- Javascript script

- Add a TextArea and right click to edit the HTML
- Add an Input Field Property Control wrapped by a tag with id='dt1'
- Add a span html tag with id='dt1picker' next to your SpotfireControl for the calendar
- Add javascript
HTML:
<span id='dt1'>
<SpotfireControl id="ed353..YourSInputPropControl" />
</span>
<span id='dt1picker'></span>
JS:
//update document property after selection
function datePicker_onSelect(selectedDate){//alert(selectedDate)
$("#dt1 input").focus()
$("#dt1 input").blur()
}
//jquery datepicker configuration
//you can comment the buttonImageOnly and buttonImage lines to show a button instead of a calendar or the image of your choice.
pickerOptions = {
showOn: 'button',
buttonImageOnly: true,
buttonImage: 'http://staff.washington.edu/tabrooks/343INFO/UnobtrusiveDatePicker/cal-grey.gif',
minDate: "-36M", maxDate: "+0D",
changeMonth: true,
changeYear: true,
altField:"#dt1 input",
onSelect:datePicker_onSelect
}
//create the date picker
document.getElementById('dt1picker').innerHTML="<input type='hidden' id='datePicker'>"
$("#datePicker").datepicker(pickerOptions);

Refer to the jquery datepicker documentation for configuration options
Popup Calendar
import clr
clr.AddReference('System.Windows.Forms')
from System.Windows.Forms import Form, MonthCalendar
#create a calendar
calendar = MonthCalendar()
#define what to do with the selected date
def onPickDate(sender,eventArgs):
selectedDate = calendar.SelectionRange.Start.ToShortDateString()
print selectedDate
Document.Properties["selectedDate"] = selectedDate
calendar.DateSelected += onPickDate
#put calendar in a form and show it
form = Form()
form.Text = "Select a date and close the form when done"
form.Controls.Add(calendar)
form.ShowDialog()
FittingModel (SF 6.0+)
# -------------------------------------------------------------------------
# Script to get the model of the logistic curve fitting
# and update a table 'Model Parameters' with it
# -------------------------------------------------------------------------
import math
from Spotfire.Dxp.Application.Visuals import VisualContent
from Spotfire.Dxp.Application.Visuals.FittingModels import FittingModelTypeIdentifiers,LogisticRegressionFittingModel
viz=visual.As[VisualContent]()
for fm in viz.FittingModels:
if fm.TypeId==FittingModelTypeIdentifiers.LogisticRegressionFittingModel:
ds = fm.GetResultsDataSource()
if Document.Data.Tables.Contains("Model Parameters"):
#Replace data if table exists table=Document.Data.Tables["Model Parameters"]
table.ReplaceData(ds)
else:
#Create table if doesn't exists Document.Data.Tables.Add("Model Parameters", ds)
# call the script yo update the Y calculationfrom System.Collections.Generic import Dictionary
from Spotfire.Dxp.Application.Scripting import ScriptDefinition
import clr
scriptDef = clr.Reference[ScriptDefinition]()
Document.ScriptManager.TryGetScript("UpdateCalcY", scriptDef)
paramDict = {"visual":visual}
params = Dictionary[str, object](paramDict)
Document.ScriptManager.ExecuteScript(scriptDef.ScriptCode, params)
# -----------------------------------------------------------------------------------------------------------------------
# Script to recalculate the Y value corresponding to the X value in property SelectedX
# using the parameters in table 'Model Parameters', created by the other script
# -----------------------------------------------------------------------------------------------------------------------
import math
from Spotfire.Dxp.Application.Visuals import VisualContent
from Spotfire.Dxp.Application.Visuals.FittingModels import FittingModelTypeIdentifiers,LogisticRegressionFittingModel
from Spotfire.Dxp.Data import DataValueCursor
viz=visual.As[VisualContent]()
x=Document.Properties['SelectedX']
if Document.Data.Tables.Contains("Model Parameters"):
table=Document.Data.Tables["Model Parameters"]
minCol=table.Columns['min']
minCursor=DataValueCursor.Create[float](minCol)
maxCol=table.Columns['max']
maxCursor=DataValueCursor.Create[float](maxCol)
hillCol=table.Columns['Hill']
hillCursor=DataValueCursor.Create[float](hillCol)
lX50Col=table.Columns['LoggedX50']
lX50Cursor=DataValueCursor.Create[float](lX50Col)
for row in table.GetRows(minCursor,maxCursor,hillCursor,lX50Cursor):
y=minCursor.CurrentValue+((maxCursor.CurrentValue-minCursor.CurrentValue)/(1.00+math.pow(10,hillCursor.CurrentValue*(lX50Cursor.CurrentValue-x))))
Document.Properties['CalcY']=y
break;
sending emails with attachments (from gmail or corporation)
# This script gets the unique values from a column and sends an email
from Spotfire.Dxp.Application.Filters import CheckBoxFilter
from System import IO, Net, DateTime
from System.Net import Mail, Mime
from System.Text import Encoding
#A) CONFIG THE SCRIPT OPTIONS
#A.1 Unique column values from table to export
myTable = Document.Data.Tables["A"]
myColumn = "Item"
#A.2 Email configuration
#gmail settings : smtp.gmail.com, port:587 encription=True credentials=True)
#corporate settings: smtp.contoso.com,port:25 encription=False credentials=False)
SMTPClient = "smtp.gmail.com"
SMTPPort = 587
useEncription = True
useCredentials = True
fromEmail = "me@gmail.com"
toEmail ="someone@abc.com"
fromEmailUsr = fromEmail
fromEmailPwd = "secretpassword"
filename = "myAttachment" + DateTime.Now.ToString() + ".csv"
myMailSubject = "Unique Values from " + myTable.Name + "." + myColumn
myMailBody = "These are the " + myMailSubject + "sent by some Spotfire geek"
#B) EXTRACT DATA for attachment
#B.1 Get uniques from myTable
s="Magic Numbers\r\n"
filt=Document.FilteringSchemes[0].Item[myTable].Item[myTable.Columns.Item[myColumn]].As[CheckBoxFilter]()
for value in filt.Values: s+=value
#B.2 encode results
ms = IO.MemoryStream(Encoding.UTF8.GetBytes(s))
#C) SEND MAIL
#C.1 go by a postcard or envelope
MyMailMessage = Mail.MailMessage()
#C.2 Prepare email
MyMailMessage.From = Mail.MailAddress(fromEmail)
MyMailMessage.To.Add(toEmail)
MyMailMessage.Subject = myMailSubject
MyMailMessage.Body = myMailBody
ct = Mime.ContentType(Mime.MediaTypeNames.Text.Plain);
attach = Mail.Attachment(ms, ct)
attach.ContentDisposition.FileName = filename
MyMailMessage.Attachments.Add(attach)
Mail.Attachment(ms, ct)
#C.3 Go to the USPS post office (Create the SMTPClient object and specify the SMTP GMail server and port)
SMTPServer = Mail.SmtpClient(SMTPClient)
SMTPServer.Port = SMTPPort
#C.4 Drop the email in the USPS outbox with the appropiate postage
if useCredentials: SMTPServer.Credentials = Net.NetworkCredential(fromEmailUsr, fromEmailPwd)
SMTPServer.EnableSsl = useEncription
print "thanks for using USPS service"
SMTPServer.Send(MyMailMessage)
Replace Data Tables from a file (client only)
# Replace tables from file
from System.Windows.Forms import OpenFileDialog
from Spotfire.Dxp.Data import *
import clr
from Spotfire.Dxp.Data import *
import clr
clr.AddReference("System.Windows.Forms")
#get filename from file chooser
d1 = OpenFileDialog()
d1.InitialDirectory='C:\myfiles\salesdata'
d1.ShowDialog()
d1.InitialDirectory='C:\myfiles\salesdata'
d1.ShowDialog()
#setup data source from selected file
myDataManager = Document.Data
ds=myDataManager.CreateFileDataSource(d1.FileName)
#replace myTable
myTable = Document.Data.Tables["T1"] #or use a DataTable script parameter
myTable.ReplaceData(ds)
myTable.ReplaceData(ds)
Get user information, login name, machine version, etc
from System import Environment
print "Machine Name:\t", Environment.MachineName
print "User:\t\t", Environment.UserName
print "Domain:\t\t", Environment.UserDomainName
print "Drives:\t\t", Environment.GetLogicalDrives()
print "Directory:\t\t", Environment.SystemDirectory
print "OS:\t\t",Environment.OSVersion, " (64 bit)" if Environment.Is64BitOperatingSystem else " (32 bit)"
print "Spotfire Exe:\t", Environment.CommandLine, " (64 bits)" if Environment.Is64BitProcess else " (32 bits?)"
print "Special Path:\t",Environment.ExpandEnvironmentVariables("%SystemRoot%\\a\\b\\c")
print "Temp Directory:\t", Environment.GetEnvironmentVariable("TEMP")
print "System folder:\t", Environment.GetFolderPath(Environment.SpecialFolder.System)
#username from webplayer or client
from System.Threading import Thread
print(Thread.CurrentPrincipal.Identity.Name )
Alert, Popup, MessageBox
import clr
clr.AddReference("System.Windows.Forms")
from System.Windows.Forms import MessageBox
MessageBox.Show("Foo")

clr.AddReference("System.Windows.Forms")
from System.Windows.Forms import MessageBox
MessageBox.Show("Foo")
"Sort axis by" on a combination chart
Assuming you have a combination chart with 'colA' and 'colB; columns, you can sort by 'colA', 'colB' or 'none'
from Spotfire.Dxp.Application.Visuals import CategoryKey
from Spotfire.Dxp.Application.Visuals import CombinationChart
#Define sorting typesmyCategoryKey0=CategoryKey() #Same as 'None'
myCategoryKey1=CategoryKey("Sum(ColA)")
myCategoryKey2=CategoryKey("Sum(ColB)")
#Perform sorting
vis.As[CombinationChart]().SortBy=myCategoryKey1
Control XY Axis zoom scale
- Create a document property called 'mySlider' as integer type
- Add a text area and add a Property Control and link it to 'mySlider' to it.
- Use the script button on the slider widget if available. Otherwise use an Action Control to triger the script once happy with the slider value selection.
from Spotfire.Dxp.Application.Visuals import AxisRange
from Spotfire.Dxp.Application.Visuals import BarChart
#from Spotfire.Dxp.Data import DataPropertyClass
#viz is a scirpt parameter pointing to a barchart visual
MyChart = viz.As[BarChart]()
#read min,max from document properties
min = Document.Properties["mySlider"].Value
#max = Document.Data.Properties.GetProperty(DataPropertyClass.Document, "mySlider").Value
#apply zoom range
MyChart.YAxis.ManualZoom = True
MyChart.YAxis.ZoomRange = AxisRange(min,max);
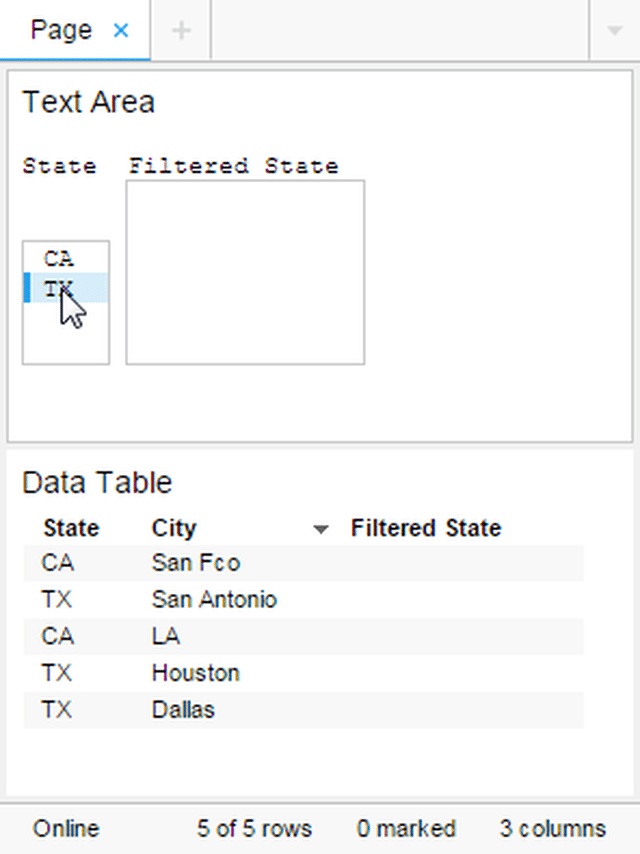
cascading dropdowns
1. Create a drop-down list Property Control to display unique values from the Region column.
2 Create a Calculated Column called ‘Filtered State’. In the expression we should check if the Region Column value equals the value specified in the property we created earlier. If it does, it will output the value from the State Column.
if ([Region] = "${whichRegion}",[State],null)
The final step is to create a second Calculated Column called ‘Filtered City’. In the expression we should check if the State Column value equals the value specified in the property we just created. If it does, it will output the value from the City Column.
if ([State] = "${whichState}",[City],null)
Note: If your want to select multiple values and your document property is associated with a multiple selection listbox, then use the following expression:
Pressing keys programatically
Why reinvent the wheel when you can send keystrokes? for example, you can filter out marked rows or add a new visualization by sending keystrokes programatically
import clr
clr.AddReference("System.Windows.Forms")
from System.Windows.Forms import SendKeys, Control, Keys
#Filter out Marked Rows same as
SendKeys.Send("(^+M)") #Ctrl+M
#Create a Box Plot
SendKeys.Send("^+{5}") #same as Ctrl+Shift+5
List of shortcuts
import clr
clr.AddReference("System.Windows.Forms")
from System.Windows.Forms import SendKeys, Control, Keys
#Filter out Marked Rows same as
SendKeys.Send("(^+M)") #Ctrl+M
#Create a Box Plot
SendKeys.Send("^+{5}") #same as Ctrl+Shift+5
List of shortcuts
Ctrl+A Mark filtered rows.
Ctrl+B Bookmarks.
Ctrl+C Copy the marked records to the clipboard as text.
Ctrl+D Duplicate active page.
Ctrl+E Unmark Resets the set of marked records. No records will be marked after you have executed this operation.
Ctrl+F Find.
Ctrl+I Inverts the set of marked records. Marks all unmarked records and unmarks the set of marked records.
Ctrl+L or Alt+L Toggles legends of a visualization on or off.
Ctrl+M Filter to, Sets the selection to the marked records. Creates a temporary filter so that only the marked records are visible.
Ctrl+N New Page.
Ctrl+O Open an existing file or a file to import.
Ctrl+P Print the active visualization.
Ctrl+R Reset all filters.
Ctrl+S Save the present visualization in the same format as when opened.
Ctrl+T Create a new text area.
Ctrl+U Duplicate visualization.
Ctrl+V Paste the clipboard contents into Spotfire.
Ctrl+Y Redo.
Ctrl+Z Undo.
Ctrl+W or Alt+F4 Close.
Ctrl+Shift+M Filter out
Ctrl+1 Create a new table.
Ctrl+2 Create a new cross table.
Ctrl+3 Create a new bar chart.
Ctrl+4 Create a new line chart.
Ctrl+5 Create a new combination chart.
Ctrl+6 Create a new pie chart.
Ctrl+7 Create a new scatter plot.
Ctrl+8 Create a new 3D scatter plot.
Ctrl+9 Create a new map chart.
Ctrl+0 Create a new graphical table.
Ctrl+Shift+1 Create a new tree map.
Ctrl+Shift+2 Create a new heat map.
Ctrl+Shift+3 Create a new parallel Coordinate plot.
Ctrl+Shift+4 Create a new summary table.
Ctrl+Shift+5 Create a new box plot.
F1 Help.
F12 Save file.
Alt+Enter or Ctrl+Enter Opens the Properties dialogue.
Delete Deletes the set of marked records.
Maximizing visualization
#Maximizes the active visualization
Application.Document.ActivePageReference.ApplyLayout(Layout.TileMode.Maximize)
Write back to the database from Spotfire
from Spotfire.Dxp.Data.Import import DatabaseDataSource
from Spotfire.Dxp.Data.Import import DatabaseDataSourceSettings
from Spotfire.Dxp.Application.Visuals import TablePlot
from Spotfire.Dxp.Application.Visuals import VisualTypeIdentifiers
from Spotfire.Dxp.Data import IndexSet
from Spotfire.Dxp.Data import RowSelection
from Spotfire.Dxp.Data import DataValueCursor
from Spotfire.Dxp.Data import DataSelection
from Spotfire.Dxp.Data import DataPropertyClass
rowCount = Document.ActiveDataTableReference.RowCount
rowsToInclude = IndexSet(rowCount,True)
#Get a cursor to the two columns we want to use. cursor1 is for the key column and cursor2 is for the column selected by the user input
cursor1 = DataValueCursor.Create[int](Document.ActiveDataTableReference.Columns["ProductID"])
cursor2 = DataValueCursor.CreateFormatted(Document.ActiveDataTableReference.Columns[whichCol])
#The following section will add a column to the database table using the name specified by the user. This assumes a column with this name does not already exist.
sqlCommand = "ALTER TABLE Products ADD " + colName + " varchar(50);"
dbsettings = DatabaseDataSourceSettings( "System.Data.SqlClient",
"Server=localhost;Database=Northwind;UID=myuser;PWD=mypass",sqlCommand)
ds = DatabaseDataSource(dbsettings)
newDataTable = Document.Data.Tables.Add("temp",ds)
Document.Data.Tables.Remove(newDataTable)
#The following section will update the specified column in the database using the key column in the where clause
sqlStr=""
for row in Document.ActiveDataTableReference.GetRows(rowsToInclude,cursor1,cursor2):
value1 = cursor1.CurrentValue
value2 = cursor2.CurrentValue
sqlStr = sqlStr + "UPDATE Products SET " + colName + "='" + value2 + "' WHERE (ProductID=" + str(value1) + ");"
sqlCommand = "UPDATE Products " + sqlStr + ";"
dbsettings = DatabaseDataSourceSettings( "System.Data.SqlClient",
"Server=localhost;Database=Northwind;UID=myuser;PWD=mypass",sqlCommand)
ds = DatabaseDataSource(dbsettings)
newDataTable = Document.Data.Tables.Add("temp",ds)
Document.Data.Tables.Remove(newDataTable)
Reference
Export Image from Visualization
from System.Drawing import Bitmap, Graphics, Rectangle, Point
from System.IO import Path
from Spotfire.Dxp.Application.Visuals import VisualContent
#1. Prepare canvas as a blank bitmap
w=640
h=480
bm = Bitmap(w,h)
g = Graphics.FromImage(bm)
r = Rectangle(Point(0,0), bm.Size)
#2. Paint visualization into canvas
#vis is a script parameter
vis.As[VisualContent]().Render(g, r)
#3. Save your canvas
#tempFolder = Path.GetTempPath()
tempFilename = Path.GetTempFileName() + ".bmp"
bm.Save(tempFilename)
print "image saved as " + tempFilename
Add JSON or XML Data from a Web Service
XML example
import clr
clr.AddReference('System.Data')
import System
from System import DateTime
from System.Data import DataSet, DataTable, XmlReadMode
from System.IO import StringReader, StreamReader, StreamWriter, MemoryStream, SeekOrigin
from System.Net import HttpWebRequest
from Spotfire.Dxp.Data import DataType, DataTableSaveSettings
from Spotfire.Dxp.Data.Import import TextFileDataSource, TextDataReaderSettings
# get stock quotes data in XML format from Yahoo Finance API
tickerSymbol = Document.Properties["TickerSymbol"]
startDate = DateTime.Today.AddMonths(-3).ToString("yyyy-MM-dd")
endDate = DateTime.Today.ToString("yyyy-MM-dd")
uri = "http://query.yahooapis.com/v1/public/yql?q=select * from yahoo.finance.historicaldata where symbol = %22" + tickerSymbol + "%22 and startDate = %22" + startDate + "%22 and endDate = %22" + endDate + "%22&format=xml&diagnostics=true&env=store://datatables.org/alltableswithkeys"
webRequest = HttpWebRequest.Create(uri)
response = webRequest.GetResponse()
streamReader = StreamReader(response.GetResponseStream())
xmlData = streamReader.ReadToEnd()
stringReader = StringReader(xmlData)
# read desired data fields from XML into a DataSet
dataSet = DataSet()
dataTable = DataTable("quote")
dataTable.Columns.Add("Date", System.String)
dataTable.Columns.Add("Close", System.String)
dataSet.Tables.Add(dataTable)
dataSet.ReadXml(stringReader, XmlReadMode.IgnoreSchema)
# build a string representing the data in tab-delimited text format
textData = "Symbol\tDate\tClose\r\n"
for row in dataTable.Rows:
textData += tickerSymbol + "\t" + "\t".join(row.ItemArray) + "\r\n"
# make a stream from the string
stream = MemoryStream()
writer = StreamWriter(stream)
writer.Write(textData)
writer.Flush()
stream.Seek(0, SeekOrigin.Begin)
# set up the text data reader
readerSettings = TextDataReaderSettings()
readerSettings.Separator = "\t"
readerSettings.AddColumnNameRow(0)
readerSettings.SetDataType(0, DataType.String)
readerSettings.SetDataType(1, DataType.Date)
readerSettings.SetDataType(2, DataType.Currency)
# create a data source to read in the stream
textDataSource = TextFileDataSource(stream, readerSettings)
# add the data into a Data Table in Spotfire
if Document.Data.Tables.Contains("Stock Data"):
Document.Data.Tables["Stock Data"].ReplaceData(textDataSource)
else:
newTable = Document.Data.Tables.Add("Stock Data", textDataSource)
tableSettings = DataTableSaveSettings (newTable, False, False)
Document.Data.SaveSettings.DataTableSettings.Add(tableSettings)
JSON example
import clr
clr.AddReference('System.Data')
clr.AddReference('System.Web.Extensions')
import System
from System import DateTime
from System.Data import DataSet, DataTable
from System.IO import StreamReader, StreamWriter, MemoryStream, SeekOrigin
from System.Net import HttpWebRequest
from System.Web.Script.Serialization import JavaScriptSerializer
from Spotfire.Dxp.Data import DataType, DataTableSaveSettings
from Spotfire.Dxp.Data.Import import TextFileDataSource, TextDataReaderSettings
# get stock quotes data in JSON format from Yahoo Finance API
tickerSymbol = Document.Properties["TickerSymbol"]
startDate = DateTime.Today.AddMonths(-3).ToString("yyyy-MM-dd")
endDate = DateTime.Today.ToString("yyyy-MM-dd")
uri = "http://query.yahooapis.com/v1/public/yql?q=select * from yahoo.finance.historicaldata where symbol = %22" + tickerSymbol + "%22 and startDate = %22" + startDate + "%22 and endDate = %22" + endDate + "%22&format=json&diagnostics=true&env=store://datatables.org/alltableswithkeys"
webRequest = HttpWebRequest.Create(uri)
response = webRequest.GetResponse()
streamReader = StreamReader(response.GetResponseStream())
jsonData = streamReader.ReadToEnd()
js = JavaScriptSerializer()
dataDict = js.Deserialize(jsonData,object)
# build a string representing the data in tab-delimited text format
textData = "Symbol\tDate\tClose\r\n"
for quote in dataDict["query"]["results"]["quote"]:
textData += tickerSymbol + "\t" + quote["Date"] + "\t" + quote["Close"] + "\r\n"
# make a stream from the string
stream = MemoryStream()
writer = StreamWriter(stream)
writer.Write(textData)
writer.Flush()
stream.Seek(0, SeekOrigin.Begin)
# set up the text data reader
readerSettings = TextDataReaderSettings()
readerSettings.Separator = "\t"
readerSettings.AddColumnNameRow(0)
readerSettings.SetDataType(0, DataType.String)
readerSettings.SetDataType(1, DataType.Date)
readerSettings.SetDataType(2, DataType.Currency)
# create a data source to read in the stream
textDataSource = TextFileDataSource(stream, readerSettings)
# add the data into a Data Table in Spotfire
if Document.Data.Tables.Contains("Stock Data"):
Document.Data.Tables["Stock Data"].ReplaceData(textDataSource)
else:
newTable = Document.Data.Tables.Add("Stock Data", textDataSource)
tableSettings = DataTableSaveSettings (newTable, False, False)
Document.Data.SaveSettings.DataTableSettings.Add(tableSettings)
import clr
clr.AddReference('System.Data')
import System
from System import DateTime
from System.Data import DataSet, DataTable, XmlReadMode
from System.IO import StringReader, StreamReader, StreamWriter, MemoryStream, SeekOrigin
from System.Net import HttpWebRequest
from Spotfire.Dxp.Data import DataType, DataTableSaveSettings
from Spotfire.Dxp.Data.Import import TextFileDataSource, TextDataReaderSettings
# get stock quotes data in XML format from Yahoo Finance API
tickerSymbol = Document.Properties["TickerSymbol"]
startDate = DateTime.Today.AddMonths(-3).ToString("yyyy-MM-dd")
endDate = DateTime.Today.ToString("yyyy-MM-dd")
uri = "http://query.yahooapis.com/v1/public/yql?q=select * from yahoo.finance.historicaldata where symbol = %22" + tickerSymbol + "%22 and startDate = %22" + startDate + "%22 and endDate = %22" + endDate + "%22&format=xml&diagnostics=true&env=store://datatables.org/alltableswithkeys"
webRequest = HttpWebRequest.Create(uri)
response = webRequest.GetResponse()
streamReader = StreamReader(response.GetResponseStream())
xmlData = streamReader.ReadToEnd()
stringReader = StringReader(xmlData)
# read desired data fields from XML into a DataSet
dataSet = DataSet()
dataTable = DataTable("quote")
dataTable.Columns.Add("Date", System.String)
dataTable.Columns.Add("Close", System.String)
dataSet.Tables.Add(dataTable)
dataSet.ReadXml(stringReader, XmlReadMode.IgnoreSchema)
# build a string representing the data in tab-delimited text format
textData = "Symbol\tDate\tClose\r\n"
for row in dataTable.Rows:
textData += tickerSymbol + "\t" + "\t".join(row.ItemArray) + "\r\n"
# make a stream from the string
stream = MemoryStream()
writer = StreamWriter(stream)
writer.Write(textData)
writer.Flush()
stream.Seek(0, SeekOrigin.Begin)
# set up the text data reader
readerSettings = TextDataReaderSettings()
readerSettings.Separator = "\t"
readerSettings.AddColumnNameRow(0)
readerSettings.SetDataType(0, DataType.String)
readerSettings.SetDataType(1, DataType.Date)
readerSettings.SetDataType(2, DataType.Currency)
# create a data source to read in the stream
textDataSource = TextFileDataSource(stream, readerSettings)
# add the data into a Data Table in Spotfire
if Document.Data.Tables.Contains("Stock Data"):
Document.Data.Tables["Stock Data"].ReplaceData(textDataSource)
else:
newTable = Document.Data.Tables.Add("Stock Data", textDataSource)
tableSettings = DataTableSaveSettings (newTable, False, False)
Document.Data.SaveSettings.DataTableSettings.Add(tableSettings)
JSON example
import clr
clr.AddReference('System.Data')
clr.AddReference('System.Web.Extensions')
import System
from System import DateTime
from System.Data import DataSet, DataTable
from System.IO import StreamReader, StreamWriter, MemoryStream, SeekOrigin
from System.Net import HttpWebRequest
from System.Web.Script.Serialization import JavaScriptSerializer
from Spotfire.Dxp.Data import DataType, DataTableSaveSettings
from Spotfire.Dxp.Data.Import import TextFileDataSource, TextDataReaderSettings
# get stock quotes data in JSON format from Yahoo Finance API
tickerSymbol = Document.Properties["TickerSymbol"]
startDate = DateTime.Today.AddMonths(-3).ToString("yyyy-MM-dd")
endDate = DateTime.Today.ToString("yyyy-MM-dd")
uri = "http://query.yahooapis.com/v1/public/yql?q=select * from yahoo.finance.historicaldata where symbol = %22" + tickerSymbol + "%22 and startDate = %22" + startDate + "%22 and endDate = %22" + endDate + "%22&format=json&diagnostics=true&env=store://datatables.org/alltableswithkeys"
webRequest = HttpWebRequest.Create(uri)
response = webRequest.GetResponse()
streamReader = StreamReader(response.GetResponseStream())
jsonData = streamReader.ReadToEnd()
js = JavaScriptSerializer()
dataDict = js.Deserialize(jsonData,object)
# build a string representing the data in tab-delimited text format
textData = "Symbol\tDate\tClose\r\n"
for quote in dataDict["query"]["results"]["quote"]:
textData += tickerSymbol + "\t" + quote["Date"] + "\t" + quote["Close"] + "\r\n"
# make a stream from the string
stream = MemoryStream()
writer = StreamWriter(stream)
writer.Write(textData)
writer.Flush()
stream.Seek(0, SeekOrigin.Begin)
# set up the text data reader
readerSettings = TextDataReaderSettings()
readerSettings.Separator = "\t"
readerSettings.AddColumnNameRow(0)
readerSettings.SetDataType(0, DataType.String)
readerSettings.SetDataType(1, DataType.Date)
readerSettings.SetDataType(2, DataType.Currency)
# create a data source to read in the stream
textDataSource = TextFileDataSource(stream, readerSettings)
# add the data into a Data Table in Spotfire
if Document.Data.Tables.Contains("Stock Data"):
Document.Data.Tables["Stock Data"].ReplaceData(textDataSource)
else:
newTable = Document.Data.Tables.Add("Stock Data", textDataSource)
tableSettings = DataTableSaveSettings (newTable, False, False)
Document.Data.SaveSettings.DataTableSettings.Add(tableSettings)
Connect to a DB Programatically via ODBC (PIOLEDB)
from Spotfire.Dxp.Data.Import import DatabaseDataSource
from Spotfire.Dxp.Data.Import import DatabaseDataSourceSettings
Category=Document.Properties["Category"]
State=Document.Properties["State"]
dbSettings=DatabaseDataSourceSettings("System.Data.Odbc","DSN=DSN Name","Dynamic SQL Query")
ds=DatabaseDataSource(dbSettings)
Document.Data.Tables["Test1"].ReplaceData(ds)
##Example using PIOLEDB
CSTR = (
"Provider=PIOLEDBENT.1;"
"Initial Catalog=DPDSDashboard;"
"Data Source=piserver.americas.ent.yourcompany.net;"
"Integrated Security=SSPI;Persist Security Info=False"
)
PROVIDER ="System.Data.OleDb"
SQL = (
" SELECT * "
" FROM [XXX].[A].[E] T1"
" CROSS APPLY [XXX].[D].[T](T1.E, DATE('t+6h+59m'), DATE('t+6h+59m'), '1d')"
" WHERE T1.Path LIKE N'\PROD\EF\HV\HV\%' AND T1.level=6"
)
from Spotfire.Dxp.Data.Import import DatabaseDataSource
from Spotfire.Dxp.Data.Import import DatabaseDataSourceSettings
dbSettings=DatabaseDataSourceSettings(PROVIDER,CSTR,SQL)
ds=DatabaseDataSource(dbSettings)
Document.Data.Tables["pi test"].ReplaceData(ds)
from Spotfire.Dxp.Data.Import import DatabaseDataSourceSettings
Category=Document.Properties["Category"]
State=Document.Properties["State"]
dbSettings=DatabaseDataSourceSettings("System.Data.Odbc","DSN=DSN Name","Dynamic SQL Query")
ds=DatabaseDataSource(dbSettings)
Document.Data.Tables["Test1"].ReplaceData(ds)
##Example using PIOLEDB
CSTR = (
"Provider=PIOLEDBENT.1;"
"Initial Catalog=DPDSDashboard;"
"Data Source=piserver.americas.ent.yourcompany.net;"
"Integrated Security=SSPI;Persist Security Info=False"
)
PROVIDER ="System.Data.OleDb"
SQL = (
" SELECT * "
" FROM [XXX].[A].[E] T1"
" CROSS APPLY [XXX].[D].[T](T1.E, DATE('t+6h+59m'), DATE('t+6h+59m'), '1d')"
" WHERE T1.Path LIKE N'\PROD\EF\HV\HV\%' AND T1.level=6"
)
from Spotfire.Dxp.Data.Import import DatabaseDataSource
from Spotfire.Dxp.Data.Import import DatabaseDataSourceSettings
dbSettings=DatabaseDataSourceSettings(PROVIDER,CSTR,SQL)
ds=DatabaseDataSource(dbSettings)
Document.Data.Tables["pi test"].ReplaceData(ds)
Add columns dynamically to a Data Table
In this example, we use a Property Control to add columns to a Table Plot Visualization. For this exercise, the Underlying data table must have 6 columns called 'col1,col2,..,col6'

Ingredients:
* Data Table Visualization
* Text Area
* Property Control
Preparation:
1) Add a Data Table Visualization and a Text Area. Edit the Text Area and add a List box (multiple select) control. Create a new property called 'groups' and add Fixed values for each item. The display name can be something like 'Group 1' and the value, a comma separated list of columns i.e. 'col2,col3,col4'.
2) Click on the Script button and add 1 tbs of the following script. If there is no script button, you would need to add a button to trigger the script:
#This script takes myDataTable Visualization as a script parameter
#It adds columns to a Data Table based on a property. The property has a comma separated list of columns for the data table to show.
#get underlying data table
#remove all columns
Ingredients:
* Data Table Visualization
* Text Area
* Property Control
Preparation:
1) Add a Data Table Visualization and a Text Area. Edit the Text Area and add a List box (multiple select) control. Create a new property called 'groups' and add Fixed values for each item. The display name can be something like 'Group 1' and the value, a comma separated list of columns i.e. 'col2,col3,col4'.
2) Click on the Script button and add 1 tbs of the following script. If there is no script button, you would need to add a button to trigger the script:
#This script takes myDataTable Visualization as a script parameter
#It adds columns to a Data Table based on a property. The property has a comma separated list of columns for the data table to show.
from Spotfire.Dxp.Application.Visuals import TablePlot, VisualContent
from Spotfire.Dxp.Data import DataPropertyClass
#get underlying data table
dt=myDataTable.As[VisualContent]()
cols = dt.Data.DataTableReference.Columns
#remove all columns
dt.TableColumns.Clear()
#get document property
#get document property
selection = Document.Data.Properties.GetProperty(DataPropertyClass.Document, "groups").Value
#parse columns from selection
#parse columns from selection
for property in selection:
for col in property.split(","):
#add columns from document property (ignore duplicates)
try:
dt.TableColumns.Add(cols[str(col)])
except:
print col + " is already in table"
- Add a Visualization Script parameter called 'myDataTable'
Create a Visualization Programatically
Bar Chart Example
#Creates a BarChart visualization from the default table
from Spotfire.Dxp.Application.Visuals import BarChart
#gets a reference to the default data table
#dataTable = Document.Data.Tables["yourTable"]
dataTable = Document.Data.Tables.DefaultTableReference
#Creates a BarChart
chart = Application.Document.ActivePageReference.Visuals.AddNew[BarChart]()
#Configure the BarChart
chart.Data.DataTableReference = myDataTable
chart.Title = "Test Bar Chart1"
chart.XAxis.Expression = "<"+str(dataTable.Columns[1])+">"
chart.YAxis.Expression = "Count(" + str(dataTable.Columns[0]) + ")"
chart.Legend.Visible = False
Table Plot Example
#Creates a TablePlot visualization from the default table
from Spotfire.Dxp.Application.Visuals import TablePlot
#gets a reference to the (default) data table
#dataTable = Document.Data.Tables["yourTable"]
dataTableReference = Document.Data.Tables.DefaultTableReference
#Creates a TablePlot
tablePlot = Application.Document.ActivePageReference.Visuals.AddNew[TablePlot]()
#Configure the TablePlot
tablePlot.Data.DataTableReference = dataTableReference
tablePlot.Title = "${DataTable.DisplayName}"
Duplicate a Visualization
myPage.Visuals.AddDuplicate(vis) #vis is a script parameter
Subscribe to:
Posts (Atom)